 Prospecting and Intros
Stand out and improve response rates.
 Sales
SalesGenerate more pipeline and close more deals.
 Sales Support
Set your sales team up for success.
 Marketing
Host video content and convert viewers into leads.
 Converting and Closing
Connect with buyers and close more deals.
 Corporate Comms
Create and deliver an internal communications strategy.
See Vidyard in Action →
“Personalized Vidyard video messages drove an 8x improvement in click-through rates and a 4x improvement in reply rates.” Read More
 Blog
BlogThe secrets to virtual selling and video best practices.
 Video Agent Hub
Case studies and how-to videos for every revenue use case.
 Help Center
How-to and help articles for all things Vidyard.
 Fast Forward
Expert advice on all things virtual selling.
 Templates
Free sales templates for every stage of the deal cycle.
 Use Cases
Explore real ways to use video across your business.
 AI Resource Hub
Guides and ideas for using AI in your workflow.
 Case Studies
Learn how our customers win more with Vidyard.
 Live Workshop Series
Showing you exactly how to put video to work.


How to Use Sales Analytics Tools to Boost Your Business
May 9, 2023
·
8 min read

Lori Connor

What are the advantages of sales analytics? The answer is aplenty. Discover how tracking sales metrics and applying sales analytics tools can make your organization more efficient and profitable.
If you aren’t already using sales analytics tools, here’s what you’re probably hearing from your team:
We’re failing to close sales. We’re missing targets. And we’re not selling enough!
Every sales pro hits these roadblocks. They’re tough to overcome. But there’s good news: You already have the tools you need to beat them—that is, sales analytics tools.
Think about your sales career. You’ve experienced setbacks and speed bumps; you’ve analyzed them to understand where you went wrong; you’ve applied those lessons to future selling. That’s sales analytics in a nutshell, and with a methodical approach, you can scale it up to help your entire sales team shine.
So, what are sales analytics used for? Sales analytics metrics and tools take a close look at sales data to answer important questions like:
- Are we the best sales team we can be? And if we aren’t, how can we get there?
- How can we make the most of our sales resources and cut the cost of selling?
- How are customer expectations and market standards changing, and what can we do to meet them?
- How can we become the innovative disruptors within our space?
According to McKinsey research, companies that analyze and act on sales behavior can increase their sales productivity by up to 20%. But what sales metrics should you be tracking? What are examples of sales analytics? How can you process them into insights? What do you do with that intelligence once you have it?
Don’t worry: Putting sales analytics tools to work is actually a breeze when you have a plan of attack. Keep reading to get the skinny on winning with sales analytics.

Who's watching your videos, and for how long? Discover your prospects' individual viewing habits.
Table of Contents
The Sales Analytics Process
Sales analytics can be a valuable asset to many businesses, but the path to achieving it can seem ambiguous. Yet, the benefits of incorporating in-depth analytics can help to identify gaps in the sales cycle, empowering companies to make better sales decisions.
To get started on this journey, consider following the four-step process we’ve outlined to execute your first sales analytics initiative. By leveraging data to optimize performance, your company will be on track toward sales success.
Step 1: Pinpoint the Problem and Hypothesize an Answer
To solve a problem, it’s important to comprehensively understand what that problem entails. Developing a hypothesis is a great way of getting started. However, the key here is to ensure that the hypothesis is verifiable, something that can be established or disproved through the gathering of sales metrics and running them through analytics tools to track the trends.
By doing this, we can find and address any underlying concerns, subsequently furthering business growth prospects.
Here are a few examples of great, actionable questions:
- Which sales activities lead to the most closed deals?
- What channels do your most valuable customers come in through?
- Is it more cost-effective to attract new customers or upsell your existing ones?
Step 2: Compile the (Right) Sales Metrics
With your question at hand, start gathering your data. Here are some things to keep in mind:
- Which metrics will definitely be relevant to answering your question?
- Which metrics might be useful? If they could help later (such as when your “definitely relevant” metrics wind up not providing a solid answer to your initial question), it’s a good idea to set up tracking now to make sure you can access that information if you end up needing it down the road.
- How often should you be monitoring data? Daily? Weekly? Monthly? Quarterly?
- Do you only need to monitor data for a specific time period, or should monitoring remain an ongoing activity?
The answers to the above will vary depending on what kind of analytical outcome you’re chasing.
Lastly, how will you compile your data? Will you do it by hand in a spreadsheet, or will you use sales analytics tools to cut down on the time and effort involved?
Remember that in order to have trustworthy analytics, you need to have trustworthy data. Ensure you’re gathering a full slate of data from all possible sources so that the resulting analytical insights truly reflect the state of your sales org.
Here’s a list of some sales, sales rep, and customer metrics worth tracking.
Sales Metrics
Monitoring essential sales metrics can help track growth, lead conversion rates, sales pipeline stages, revenue per sale, and video view data insights. We’ll dive into each of these in more detail below.
Sales to Date, Sales Growth, and Sales Target
Know how much you’ve sold, how much you’re projected to sell, and how much you should be selling. These are three basic but crucial sales analytics metrics to keep an eye on. When that data’s right in front of you, you can compare your current performance to ensure it stacks up—and make quick adjustments if your sales numbers deviate from expectations.
Sales by Lead Source, Average Lead Response Time, and Lead Conversion Rate
Most successful deals start out as leads, so collecting and analyzing lead data is key. These metrics help you quantify where your sales leads come from and which lead generation strategies are (or aren’t) working. You can also explore how quickly you’re responding to leads (ensuring that you’re getting back to them before a competitor does) and how effective you are at ultimately turning those leads into wins.
Length of the Sales Process and of Each Pipeline Stage
Moving prospects through your sales process in a timely fashion is important for maintaining momentum. Knowing the length of each part of the sales process—and in which stages on-the-go deals are currently residing—gives you insight into where you should be allocating resources to make sure deals don’t get stuck.
Opportunity-to-Close, Quote-to-Close, and Overall Conversion Rate
By tracking how many opportunities and quotes make it to close (whether won or lost), you can determine where (and why) leads fall out and plug those holes in your sales funnel. Is it a weakness in reps’ skill sets? An issue with your overall sales approach? You won’t know until you analyze the data.
Deal Size, Revenue per Sale, and Average Sale Value
A hack to boost sales revenue is to increase the value of each sale you make. Understanding deal sizes lets you see how far you’ve come, understand how your sales pipeline is changing, predict how many deals you’ll need to hit quota, and create a foundation for increasing the magnitude of future sales.
Sales and Revenue by Territory and Market
Your sales opportunities and successes are bound to vary between regions. Follow the data to track which markets you excel in and which ones you don’t. Plus, it also grants a better understanding of your penetration into each market, letting you pinpoint underserved markets while avoiding ones that are near saturation.
Cost of Selling
The cost of each deal takes a bite out of overall profit, so it’s a data point you’ll want to keep a firm handle on. Track this metric to better understand how much each sale is costing you—and where there are opportunities to invest funding to secure more sales.
Video View Data
If you’re selling with video (and you should be), you want to know more than just your videos’ view counts. Get insight into who’s watching your videos and how long they’re watching for to prioritize follow-up with prospects. Which of your reps are performing best with video? When you know who’s doing well, you can pinpoint how they’re doing well and cascade that edge to the rest of the team.
Sales Rep Metrics
Sales numbers and quotas are crucial to your strategy, helping predict reps’ sales and increasing their skills over time.
Quota Attainment, Overall Sales per Rep
Sales numbers and quota are metrics that are as old as time, and they form an important touchstone for your overall sales strategy. All this information helps you predict both how much reps should be selling and how you can expect those numbers to increase over time as they develop more skills within their roles.
Adoption of New Sales Tools
Using cutting-edge selling tools like video can be the silver bullet that seals the deal, so it’s important to track which reps are fastest on the draw. With this data, you can give reps who are excelling with new tools a pat on the back—and give reps who are struggling the support they need to feel comfortable using those tools.

Learn the fundamentals behind effective video selling in our free 20-minute Video Selling Master Class.
Take the Video Selling Master Class
Learn how to sell with video in our free on-demand class.
Customer Metrics
Businesses wishing to retain customers and drive revenue need to track relevant customer metrics. Churn rates, NPS, lifestyle trends, and sales technique reception can help make informed long-term decisions and your customers happier.
Churn Rate, Net Promoter Score
It’s important to know both how good you are at retaining your customers and how much those customers like you. These metrics shed more light on when and why customers move away from your business. You can harness that information to better appeal to customers and compel them to stay.
Percentage of Revenue from New/Existing Customers, Customer Lifetime Value
The deeper understanding you have of your customers’ buying habits, the better. These data points help you understand where to dedicate resources—is it more effective to bring new customers in the door, or do cross-sell and upsell activities deserve more bandwidth? You can also more effectively project just how much revenue a customer will bring to your organization, letting you make more informed long-term decisions.
Customer Reception to Selling Techniques
What techniques resonate most with your customers? Is it the rapid response to questions? The personal touch? New selling tools like video? By tracking what techniques lead to the best outcomes, you can pinpoint the ones that work and get your whole team using them to maximize your sales results.
The team behind the Clari sales analytics software platform dives into important metrics to track. Watch this talk on deal pipeline, or check out their conversations on the importance of sales linearity and deal slippage.
Step 3: Apply Sales Analytics Tools
Once you’ve got your sales data, it’s crucial to process it into actionable analytics. While you can go the tedious manual route with a spreadsheet, it’s far easier and quicker to use CRM analytics tools. Not only do they cut down on processing time, but they also simplify the analysis phase by visually presenting your data through interactive dashboards.
No one likes squinting at rows of numbers, which is why it’s always best to view your analytics in image format. Interactive dashboards enhance visualization and allow for drilled-down information exploration, providing more scope for spotting trends that might slip under the radar otherwise.
Suppose you’ve got anybody boasting significant data science skills on your team—now’s the perfect time to utilize their expertise to ensure you’re not missing any insights. With the help of such tools and experts, you can fully realize the value of your sales data and stay ahead of the curve.
Here’s an overview of some sales analytics tools worth using and the associated sales analytics use cases for each.
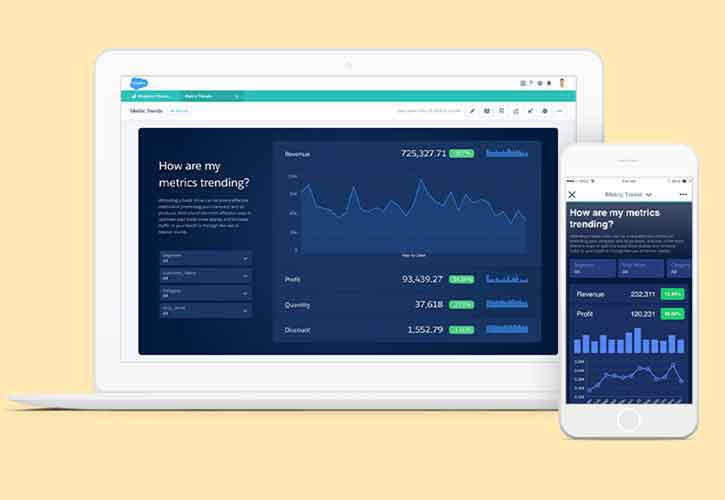
Salesforce Tableau
Salesforce is one of the most-used CRM and analytics solutions. It’s an all-in-one data management and sales analytics tool that lets you act on data within the context of your full CRM environment. Advanced Salesforce analytics opens up a whole range of investigations, including predictive insights, while Salesforce dashboards make it easy to view results.
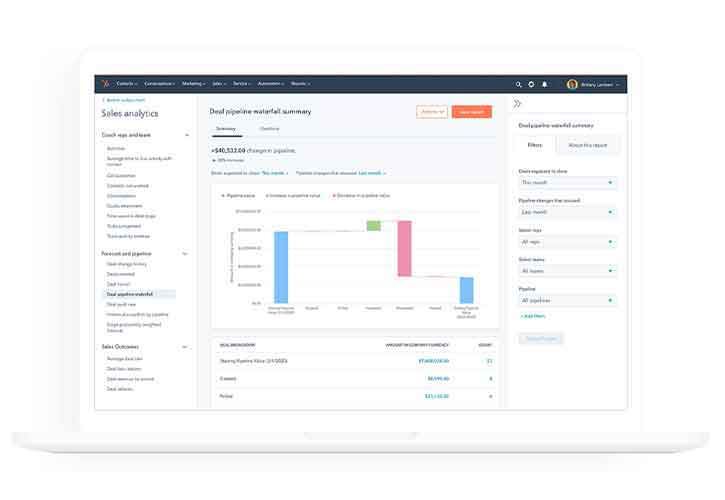
HubSpot Sales Hub
Just like Salesforce, HubSpot Sales Hub stands as a powerful and incredibly user-friendly sales analytics tool that seamlessly integrates with HubSpot’s complete CRM solution.
Designed with smaller businesses in mind, HubSpot Sales Hub offers a range of features to help track and streamline sales processes, from lead generation to quote creation. By combining the tool’s versatile analytics capabilities with the power of HubSpot’s CRM, sales teams are able to simplify their workflows and improve their bottom line performance more rapidly than with other comparable options on the market.
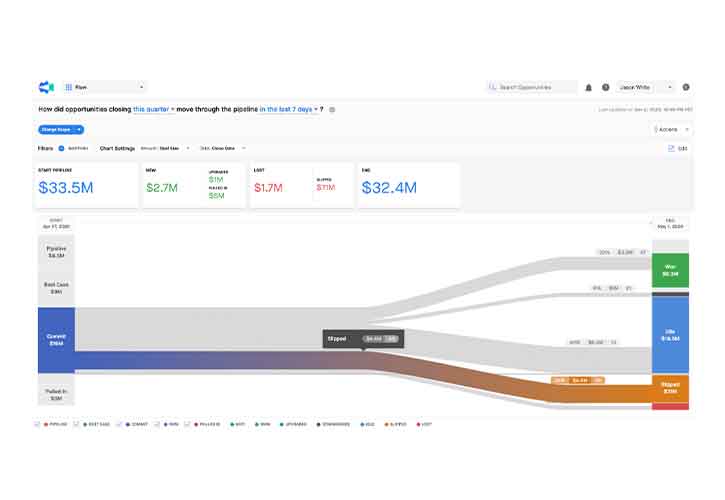
Clari
Clari’s sales analytics tools offer a comprehensive solution to manage your sales pipeline efficiently. Its features surpass those of a standard CRM analytics solution and provide attractive dashboards to better visualize sales performance. With deeper insights into the sales pipeline, the sales and marketing teams can understand how deals flow and make data-driven decisions.
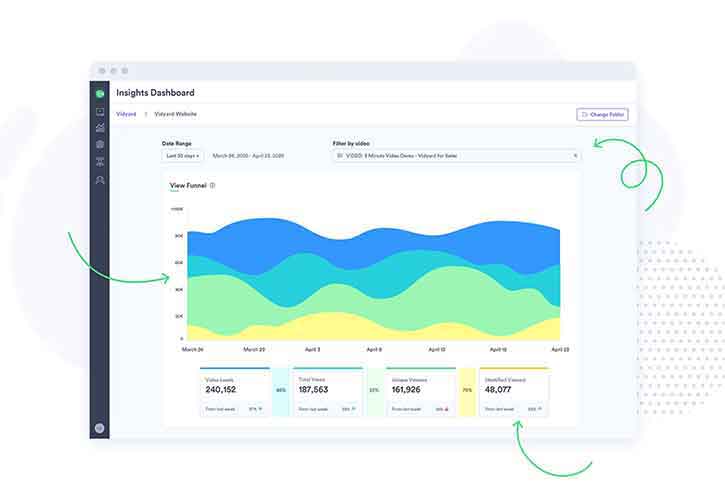
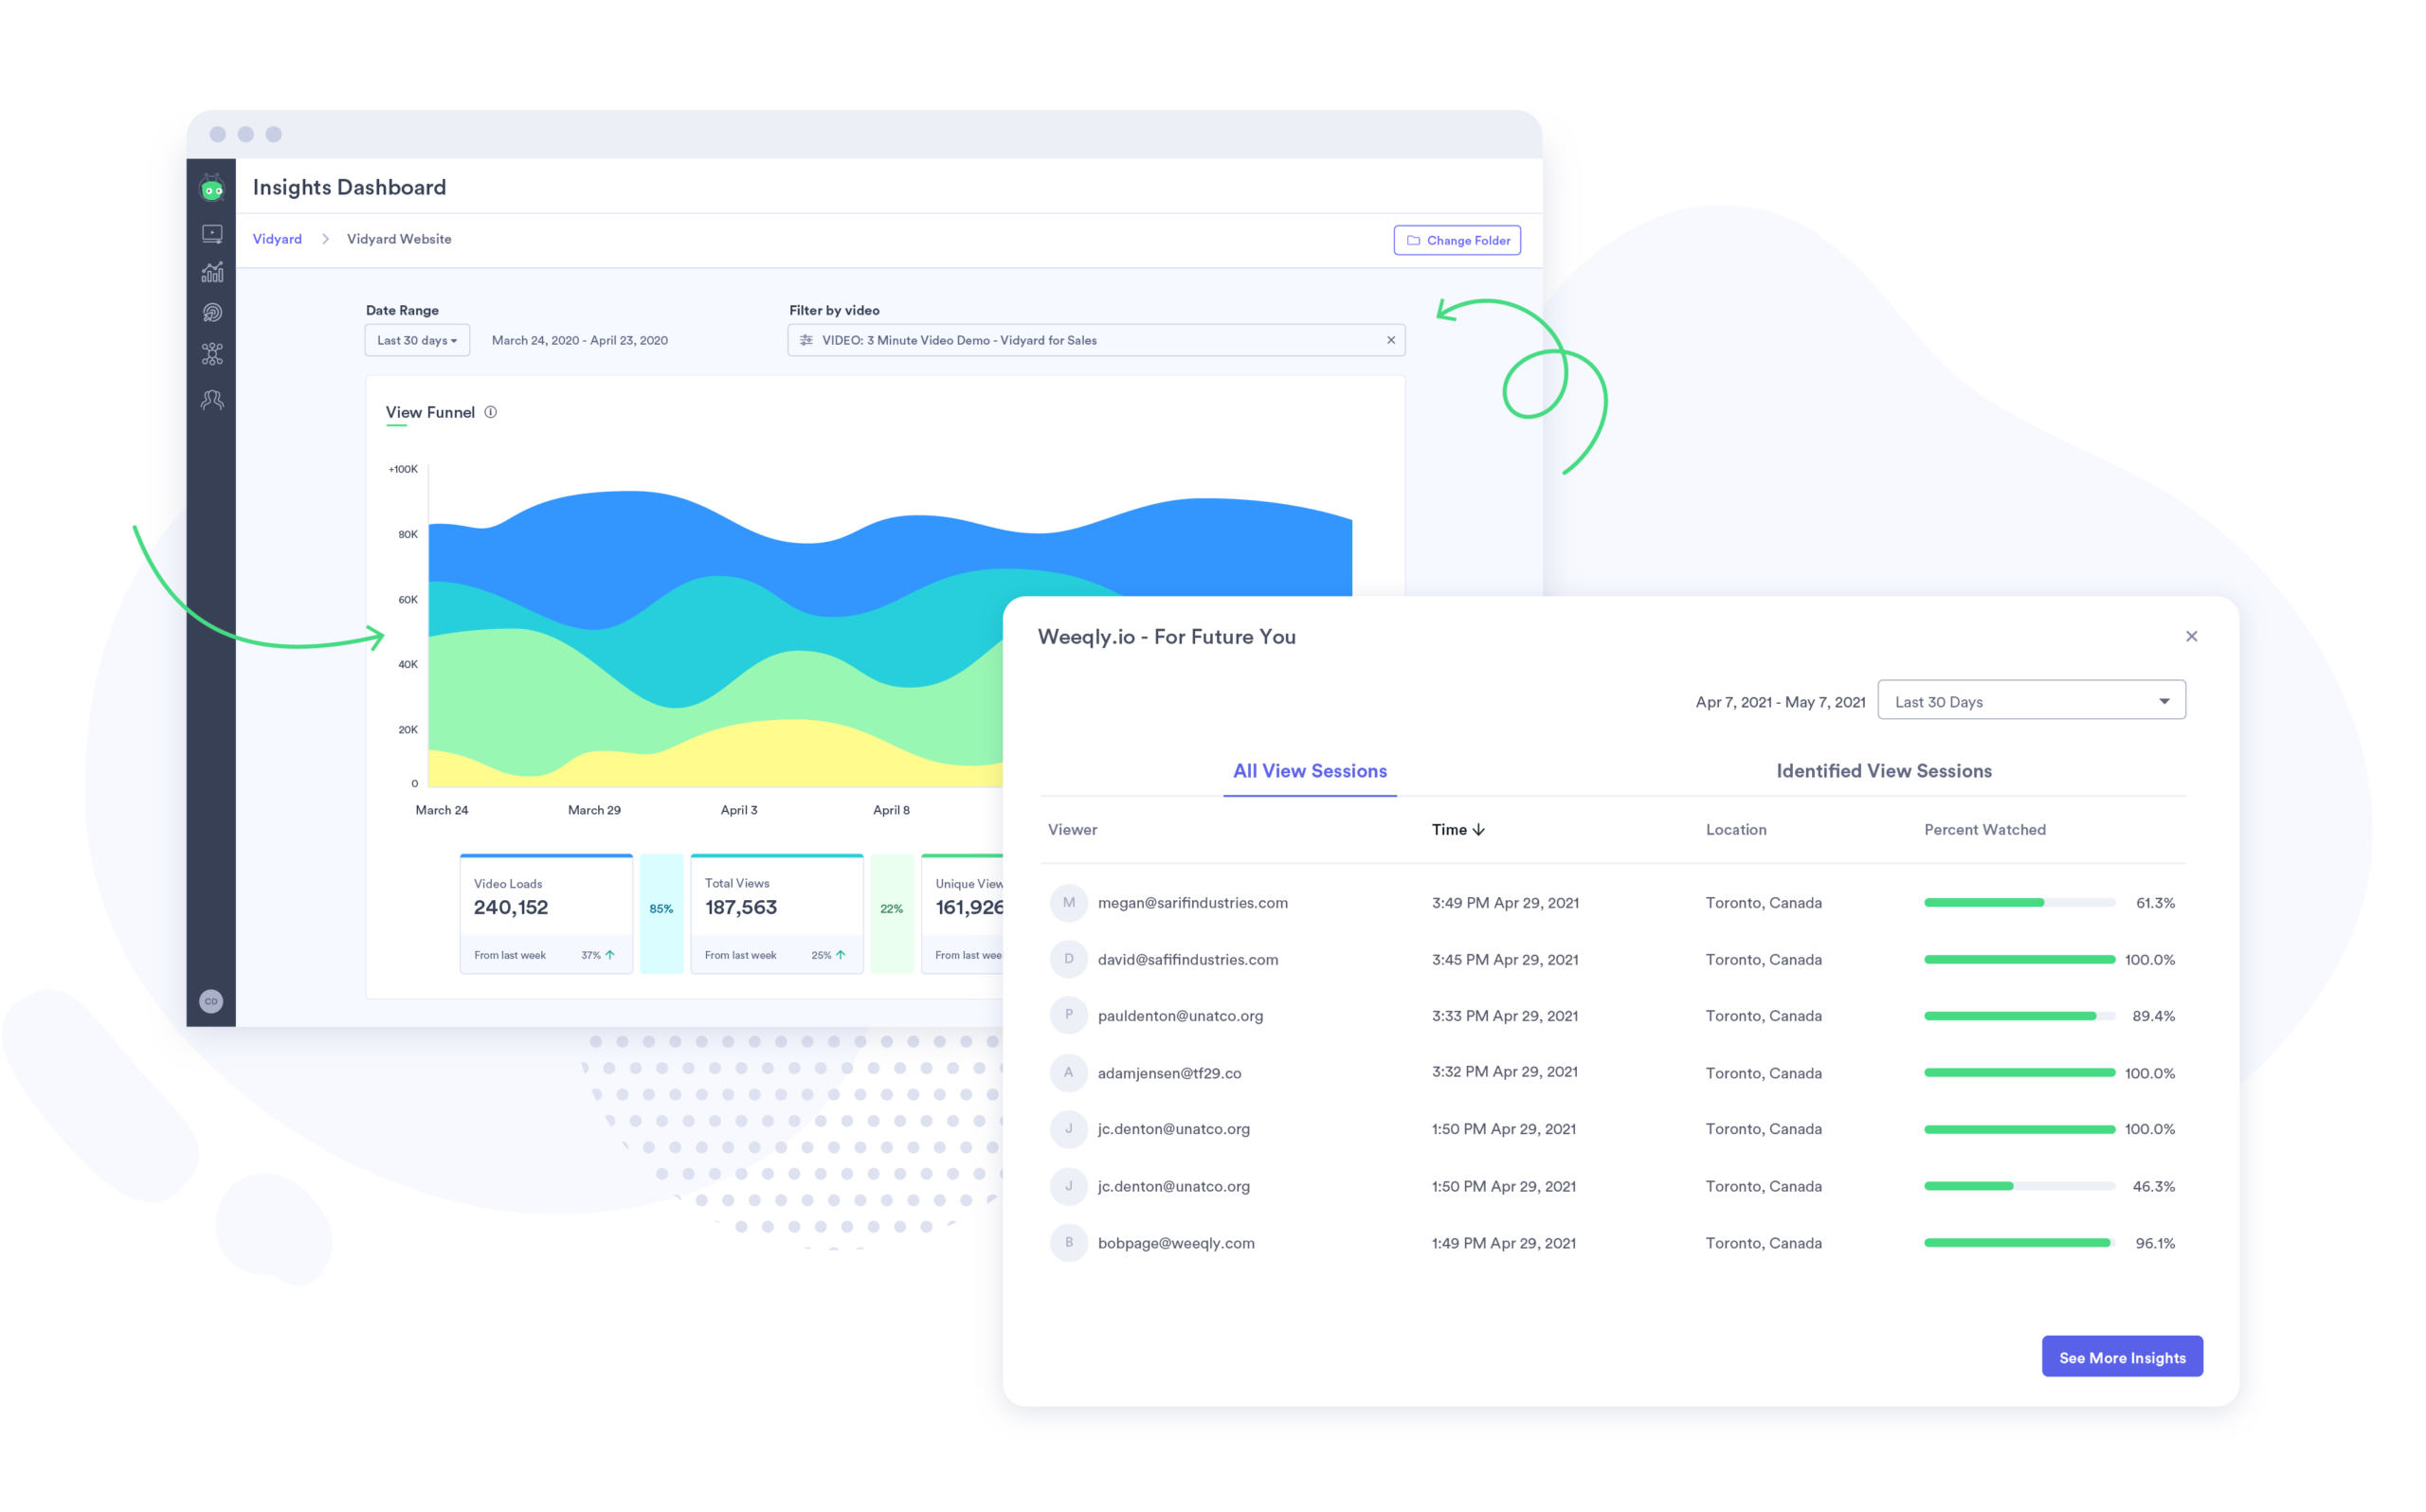
Vidyard Analytics
If you’re selling with video, you’ll want to know how those videos (and your sales team) are performing.
View counts only tell you that your videos are getting watched—not how your viewers are engaging with them. A paid Vidyard plan gives you access to the Insights Dashboard. You’ll be able to get deep into the specifics of who’s watching (and how).
Video analytics can answer questions like:
- Who are your viewers? Which video topics is each individual viewer interested in?
- How many of the people who click your links actually load the video, then watch it, then get identified as leads?
- How many impressions and actual clicks do your in-video calls to action get?
- Which of your team members are engaging their viewers the most?
You can pinpoint which reps are doing well (and not so well) with video. Use this intel to spur video adoption, spread top reps’ winning tactics to the rest of your team, and provide coaching where it’s most needed.
Bonus: Vidyard also integrates with Salesforce’s sales analytics tools. It plugs in video view data so you can track views on lead and contact records, build lead lists based on video engagement, and measure video’s tangible ROI.
Other Sales Analytics Tools
There are plenty more powerful sales performance analytics tools than those mentioned here. Check out G2’s comprehensive list of top-rated sales analytics tools.
Step 4: Put Your Findings to Work
Now that you have your analytical findings in hand, it’s time to compare them to your initial question.
Do your results answer the question you first posed? If so, great! It’s time to take those findings, put them in front of relevant decision-makers, and use them to help propel adjustments to your sales activities. But don’t stop tracking your data. Once you’ve made changes based on your findings, you’ll want to examine the sales analytics metrics again at a later date to make sure the changes are having the effects you anticipated.
If the analytical insights don’t answer the question you had in mind, it’s time to go back to the drawing board. Rethink your question, gather new data, and run the analytics again. Keep iterating on your hypothesis until you arrive at the answer you need.
From Good to Great: Achieving Excellence with Sales Analytics
And that’s it! By taking these four straightforward steps, you can refine your sales organization with robust analytics. By carefully analyzing the data generated through these analytics, you can identify areas where your team can improve and leverage its strengths to be the leanest, meanest selling machine it can be.
Embrace this approach, and you’ll see your team’s performance soar with each passing quarter. Not only will it help reduce overhead costs, but it will also drive revenue growth through measurable improvements in efficiency and effectiveness. Ultimately, the right sales analytics-driven strategy can differentiate between middling success and true market prominence.
This post was originally published on January 5, 2021. It was updated on May 9, 2023.

")

