 Prospecting and Intros
Stand out and improve response rates.
 Sales
SalesGenerate more pipeline and close more deals.
 Sales Support
Set your sales team up for success.
 Marketing
Host video content and convert viewers into leads.
 Converting and Closing
Connect with buyers and close more deals.
 Corporate Comms
Create and deliver an internal communications strategy.
See Vidyard in Action →
“Personalized Vidyard video messages drove an 8x improvement in click-through rates and a 4x improvement in reply rates.” Read More
 Blog
BlogThe secrets to virtual selling and video best practices.
 Video Agent Hub
Case studies and how-to videos for every revenue use case.
 Help Center
How-to and help articles for all things Vidyard.
 Fast Forward
Expert advice on all things virtual selling.
 Templates
Free sales templates for every stage of the deal cycle.
 Use Cases
Explore real ways to use video across your business.
 AI Resource Hub
Guides and ideas for using AI in your workflow.
 Case Studies
Learn how our customers win more with Vidyard.
 Live Workshop Series
Showing you exactly how to put video to work.


The Top Video Marketing and Sales Stats that Matter
Jul 14, 2023
·
13 min read

Alanna Gurr

We’ve compiled the top video statistics that matter to businesses, from video for sales calls and virtual conferences to video marketing trends for social media.
We know it can be hard to justify spending resources on a new content type without the data, especially for data-driven businesses. So if you—or your boss—are looking to understand the power of video and want the stats to back it up, then look no further. We’ve compiled the top video marketing statistics that matter to businesses to help you make the best decision for your marketing needs.
Or if you’re a sales leader or rep looking for more intel or insight on how video can grab your prospect’s attention, accelerate deal cycles, and close more business—we’ve got you covered too.
Table of Contents
The Sales Stats You Need to Know
Trends and stats in sales can be difficult to stay on top of. Things like the use of video messages for sales have exploded in recent years. Knowing how you stack up against industry video benchmarks, you can make smarter tech investments and strategic decisions for your sales org. Look at the virtual selling and video statistics below (plus their linked sources) to level up and have these handy stats and facts in your back pocket.
Sales Prospecting Stats and Facts
- The majority of sales pros agree that video email outperforms text-based email. (Vidyard, 2023)
- Over half of BDRs and SDRs cite connecting or booking meetings as the top challenge in their roles (Vidyard, 2023)
- People are 13% more likely to remember details from video emails over text emails. (B2B DecisionLabs, 2021)
- Videos for outbound prospecting, pre or post-meeting follow-ups, and follow-ups to an initial outreach are the top three video messaging use cases for BDRs and SDRs (Vidyard, 2023)
- Video email can reduce inbox fatigue, and help recipients retain more of the message when compared to text-based email. (B2B DecisionLabs, 2021)
- Using video for sales outreach has increased response rates for more than 60% of sales reps. (Vidyard, 2023)
- 65% of viewers watch a business-related video all the way through if it’s less than 60 seconds (Vidyard, 2023)
- Sales pros report buyers are 50% more responsive to messages sent via sales engagement platforms or other sales technologies when at least one video is included as part of the sales cadence. (Vidyard, 2023)
- 46% of people remember details from a text email, but 59% of people remember details from a video within an email. (B2B DecisionLabs, 2021)
- Hybrid video (a recording of yourself and your screen) garners the highest response rate over selfie-style or traditional screen recording videos. (Vidyard, 2023)
- Many financial services professionals feel like they have gotten to know clients or customers (66%), vendors and partners (50%), and leadership (42%) better by interacting through video more often. (Vidyard, 2022)
- Globally, 61% of buyers say they can get as much value from meeting suppliers over video conference as they can from in-person visits. (McKinsey, 2022)
- 64% of meetings booked resulted from prospects who received a short video first, followed by a short infographic. (B2B DecisionLabs, 2022)
- 76% of outbound sales professionals follow a structured sales cadence and report that their sales cadence with new prospects consists of between six and 20 touch points or messages. (Vidyard, 2023)
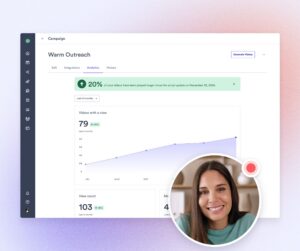
With a one-time workflow setup, you can continuously send personalized videos on your team’s behalf.
Stats Around Deal Acceleration
- Over 60% of account executives use video messages in their sales process. (Vidyard, 2023)
- 64% of account managers and executives report they are satisfied or very satisfied with the results they are getting from the use of video messaging. (Vidyard, 2023)
- Videos for outbound prospecting, demos, and follow-ups to an initial outreach are account management professionals’ top three video messaging use cases. (Vidyard, 2023)
- Over one-third of sales pros who use custom-recorded video report that it has shortened their sales cycle, and nearly half report that it has increased close rates. (Vidyard, 2023)
- Adding a video to your proposal can increase close rates by up to 41%. (Proposify, 2022)
- Video drives 56% higher proposal engagement and helps close your deal 26% faster. (Proposify, 2022)
- Video first touch, followed by infographic, performed 400% better, creating more opportunities than other cadences. (B2B DecisionLabs, 2022)
- 83% of all opportunities were created when a video was sent first. (B2B DecisionLabs, 2022)
Customer Success and Support Stats
- Nearly 70% of customer success reps have adopted video messaging to use in their sales process. (Vidyard, 2023)
- 74% of customer success pros are satisfied with the results they get from video messaging. (Vidyard, 2023)
- 65% of customer success pros use video for product or solution demos. (Vidyard, 2023)
Virtual Selling Stats and Sales Trends
- Over 90% of sales pros report that their team is fully remote or works from the office part-time, and nearly all (96%) want to continue working this way. (Vidyard, 2023)
- Overall, video creation increased by 88% last year. (Vidyard, 2025)
- Over 70% of sales leaders who aren’t using video for sales are looking to adopt it shortly. (Vidyard, 2023)
- 74% of sales pros report they’ve been able to maintain or increase their productivity with the use of video. (Vidyard, 2023)
- Most sales pros report that it’s getting harder to reach buyers, sales cycles are getting longer, more touches are required to close deals, and more stakeholders are involved in the buying process. (Vidyard, 2023)
- 96% of financial services professionals would permanently give up a percentage of their salary to work from home. (Atomik Research, 2022)
- The top five remote or hybrid technologies sales pros would take with them to their next job are Salesforce, Vidyard, Salesloft, Outreach, and Gong. (Vidyard, 2023)
- 64% of those who transitioned to virtual sales this year met or exceeded revenue targets, compared to 50% of the leaders who did not make the transition (HubSpot, 2021)
- Video and CRM tools were the number one and two enablers of success (HubSpot, 2021)
- 63% of sales leaders say virtual meetings are equally or more effective than in-person meetings. (HubSpot, 2021)
- On average, most financial service professionals use video to virtually meet with their customers or clients. (Atomik Research, 2022)
- 80% of respondents indicated their organization saved money by transitioning to a business model that relies on virtual meetings rather than in-person meetings. (Atomik Research, 2022)
- Only 1% of financial services professionals report that their organization still relies mostly on in-person meetings. (Atomik Research, 2022)
- 89% of financial services professionals say that sending video messages to their clients and prospects would be more impactful than text-based messages. (Atomik Research, 2022)
- 50% of financial services professionals believe incentives tied to the adoption of new business technologies, such as providing employees with decent training on new business technologies, would lead to more widespread adoption of new technologies within their organization. (Atomik Research, 2022)
- 81% of financial service professionals indicate that access to technology for virtual selling is the number one must-have for their work. (Atomik Research, 2022)
- 62% of sellers now interact with customers over digital channels and do not meet face-to-face (i.e., a mix of telephone, online chat, self-serve portals, email, and video conferencing). (McKinsey, 2022)
- 65% of B2B companies across industry sectors now offer e-commerce capabilities, defined as fully executing a sales transaction online. (McKinsey, 2022)
- About 61% of B2B sellers offer products/services via video conference over in-person selling, an increase from around 42% pre-COVID. (McKinsey, 2022)
- 13% of B2B companies’ revenue is driven by video conferences. (McKinsey, 2022)
- Budget constraints, economic factors, and connecting or booking meetings with potential customers are cited as top challenges currently faced by sales professionals. (Vidyard, 2023)
- 30% of sales pros say deal cycles are getting longer, and 57% report the number of touch points needed to close deals has increased. (Vidyard, 2023)
- Only 7% of sales pros report they sell to a single decision-maker. (Vidyard, 2023)
Video Marketing Stats You Can’t Ignore
Marketing teams and content builders around the world have already been embracing the shift to digital channels in this last decade, but the COVID-19 pandemic forced businesses to rethink their traditional marketing campaigns to online platforms using video and they haven’t looked back.
Social media, websites, and YouTube are the most popular places to distribute video content. Looking at our roundup of video marketing statistics, a picture is painted of an industry moving digital and the data to back your business’s case to embrace video marketing too.
Video Marketing Strategy
- The top three video distribution channels for marketers in order are social media, websites, and YouTube. (Vidyard, 2022)
- 92% of marketers who use video say that it’s an important part of their marketing strategy. (HubSpot, 2022)
- 86% of businesses use video as a marketing tool. (Wyzowl, 2022)
- A huge proportion of marketers (92%) continue to value video as an ‘important part’ of their marketing strategy. (Wyzowl, 2022)
- 79% of non-video marketers say they expect to start using video as a marketing tool in 2022 (10% more than last year.) (Wyzowl, 2022)
Video Publishing and Production Statistics
- The education, consulting, professional services, financial services, and high techindustries saw the biggest year-over-year growth in video creation (Vidyard, 2025)
- Companies create a broad range of different videos. 42% mostly use live-action videos, 33% primarily use animated videos and 16% mainly use screen recorded videos. (Wyzowl, 2022)
- On average, most people 40% spend $0-500 on a typical video, with the overwhelming majority 97% spending less than $10,000. (Wyzowl, 2022)
Video Length Statistics
- People watch an average of 19 hours of online video per week (this is an increase of 1 hour per week compared to 12 months ago, and a staggering 8.5 hour increase per week across the past 3 years). (Wyzowl, 2022)
- In 2018, people watched an average of 1.5 hours per day of online video. Our 2022 survey shows this has risen to an average of over 2.5 hours per day. (Wyzowl, 2022)
- The global pandemic has overwhelmingly impacted the amount of time people spend watching videos online. Minutes watched increased 85% in 2020. And, people watched 12.2 billion minutes of video last year; that’s 23,211 years’ worth of content. (HubSpot, 2021)
- The number of videos in the 30–60 minute category grew 140% compared to 2019. This suggests that longer-form content is becoming a more popular option for businesses as more companies embrace video series and other long-form video content. (HubSpot, 2021)
Stats Around Video Engagement
- 88% of people would like to see more videos from brands. (Wyzowl, 2022)
- People are twice as likely to share video content with their friends than any other type of content. (Wyzowl, 2022)
- 65% of viewers will watch a business-related video to the end of it if it’s under 60 seconds (Vidyard, 2023)
- Only 20% of viewers finish a video if it’s longer than 20 minutes (Vidyard, 2023)
- Editing longer-form content like on-demand webinars to under 20 minutes in length can increase viewer retention by 58% (Vidyard, 2023)
- Video results receive 1.5 engagements per mention (HubSpot, 2022)
- 84% of consumers said watching a brand’s video convinced them to make a purchase or subscribe to a service. (HubSpot, 2022)
Online Video Statistics
- Millennials watch online videos for 2.4 hours per day, while Gen Z averages 3.4 hours. (HubSpot, 2020)
- 51.7% of global internet users aged 16 to 64 say that watching videos, TV shows, and movies is their primary reason for using the internet. (Hootsuite, 2021)
- 72% of households with wireless internet stream video on their connected TV screens. (Think With Google, 2020)
- Between 2013 and 2018, online video consumption increased by an average of 32% per year. (Sprout Social, 2020)
Mobile Video Statistics
- Roughly 71% of Gen Z teens use mobile devices to watch videos, while 51% use mobile for social media surfing. (HubSpot, 2020)
- People are 1.5 times more likely to turn to mobile phones to watch a video. (Facebook, 2020)
- People are 1.5x more likely to watch video daily on a smartphone than on a computer. (Facebook, 2020)
Video Email Statistics
- A video thumbnail can improve subscriber engagement by almost 41% when it’s included in an email. (Campaign Monitor, 2020)
- Using the word “Video” in a subject line can increase open rates by 6%. (Super Office, 2020)
- Video content in emails can improve click-through rates by up to 300%. (Campaign Monitor, 2020)
- Adding video content to emails can potentially reduce opt-outs by 75%. (Campaign Monitor, 2020)
Video SEO Statistics
- Video is the number one form of media used in content strategy, overtaking blogs and infographics. (HubSpot, 2020)
- You have 53x more chances of ranking on the first page of Google if you have videos on your website. (MonsterInsights, 2022)
- Converting blogs into videos can provide you with a new source for driving traffic, as videos can boost your organic traffic by 157%. (MonsterInsights, 2022)
- By 2022, video traffic will amount to 82% of all online consumer traffic, providing SEO experts with an opportunity to gain lots of traffic. (SerpWatch, 2022)
- 78% of businesses say they received more traffic after implementing videos in their content strategies. (SerpWatch, 2022)
- 69% of businesses got more leads with video content, while 54% boosted sales. (SerpWatch, 2022)
- 60% say leads/clicks are the main determining factor of video marketing success. (Wyzowl, 2022)
- 87% of marketers say video has helped them increase traffic. (Wyzowl, 2022)
Video Content Marketing Statistics
- 64% of B2B marketers increased their use of audio or visual content (videos, live streaming, and webinars) in 2019 over their previous commitment. (Content Marketing Institute, 2019)
- When asked how they’d most like to learn about a product or service, 73% said they’d prefer to watch a short video. This compares to 11% who’d rather read a text-based article, website or post, 4% who’d like to view an infographic, 3% who’d rather download an ebook or manual, 3% who’d rather attend a webinar or pitch, and 3% who’d like a sales call or demo. (Wyzowl, 2022)
- Aside from ranking high-budget video features as the least likely reasons for watching videos, millennials and Gen Z differ from older age groups in that they’re more accepting of user-generated content over professionally made videos. (HubSpot, 2020)
- More than 99% of current video marketers will continue using video in 2021, and 96% plan to increase or maintain their spending. (HubSpot, 2021)
- In 2021, there was a 40.5% year-over-year increase in the use of proposal videos. This is up from a 31% YOY increase in 2020. (Proposify, 2022)
- Video remains on top as the #1 form of media used within content strategy in 2021. (HubSpot, 2021)
Virtual Conference and Webinar Statistics
- Data shows that by June 2020, attendees were spending 28x more time attending virtual events than they had been in January 2020. In November, that figure jumped to 34x more than in January. In total for 2020, nearly 75 million attendees registered for more than one million virtual events on Eventbrite and logged over 100 million hours. (Eventbrite, 2020)
- 53% of virtual event consumers said they plan to attend both virtual and in-person events in the future—even when it is safe to gather in person again. (Eventbrite, 2020)
- 25% of people watch webinars from their mobile device. (Work Cast, 2020)
- The sudden shift to virtual events in 2020 produced mixed results in terms of attendance. While just over half of the events lost audience in the transition, 46% gained attendees as a result. Removing travel requirements and audience familiarity with video presentations worked together to keep event attendance largely intact. (Business Wire, 2020)
- 64% of B2B tech buyers expect to spend more on web conferencing software in 2021. (Trust Radius, 2021)
- 50% of attendees at virtual events in 2020 were neutral on their experience, more or less getting what they expected. But nearly a third indicated that they had a better experience than expected. (Business Wire, 2020)
- 56% of webinar hosts said that they used both live and on-demand video. (Letter.ly, 2020)
- According to webinar attendance statistics, most people will only sign up for one live event per week. (Letter.ly, 2021)
- 57% of marketers now use live video within their strategies. (Smart Insights, 2020)
- The most effective video channel statistically was the webinar. Usage held steady at 62% from last year (after a rise from 46% in 2019) but a whopping 90% of marketers who held a webinar said it was an effective tool, making it the most widely praised video marketing channel of all those listed. (Wyzowl, 2022)
- Over a third (34%) of marketers are making use of Facebook’s live streaming options, creating in-the-moment videos that allow viewers to react in real-time. Instagram is the second most popular option, with 13% creating live videos on the platform. (Smart Insights, 2020)
- 91% of webinar marketers say webinars have been a success, making it the most effective video marketing channel. (HubSpot, 2021)
Social Media Video Statistics
- Half of Gen Z and Millennials “don’t know how they’d get through life without video.” (HubSpot, 2020)
- Social media videos make up 68% of the most commonly created types of videos (Wyzowl, 2022)
- There are over half a billion more people using social media worldwide than at the same time last year, indicating an almost 14% year-over-year increase. (HubSpot, 2022)
- 54% of marketers say video is the most valuable content for achieving social media marketing goals. (Sprout Social, 2022)
- 93% of companies have acquired new customer(s) via social media videos. (Sprout Social, 2022)
Facebook Video Statistics
- 26.4% of the platform’s user base is made up of millennials. That said, over one-third (36%) of Facebook’s audience is 45 or older. (Sprout Social, 2022)
- Facebook video (in-feed) is the most popular type of video content on the platform (51% of users), slightly less than Facebook Live and Watch combined (57%). (Sprout Social, 2022)
- In a 2019 study, 46% of social media users watched videos on Facebook. (Sprout Social, 2020)
- Facebook says that most people will watch other video types to the end if they are 15 seconds long. One study found that 2 to 5 minutes was the range to aim for if you want higher engagement. (Sprout Social, 2020)
Instagram Video Statistics
- People share 95 million photos and videos on Instagram every day (WordStream, 2022)
- Usage of Instagram grew to 72% from 60% last year, with an effectiveness rating of 85% up from last year’s 82%. (Wyzowl, 2022)
- Since its conception, over 40 billion photos and videos have been shared on the Instagram platform. (WordStream, 2022)
- Globally, Instagram video is the most engaging type of content, bringing in an average of 24.25 comments and 1097.9 likes per post. (HubSpot, 2022)
- Over 80% of smartphone users watch videos with their phones held vertically, so always design your content with this orientation in mind! (HubSpot, 2022)
- In a 2019 study, 51% of social media users watched videos on Instagram. (Sprout Social, 2020)
- Instagram feed videos are recommended at 26 seconds. (Sprout Social, 2020)
- 91% of users watch videos on Instagram weekly. (Sprout Social, 2022)
LinkedIn Video Statistics
- 68% of video marketers plan to include LinkedIn in their 2022 video marketing strategy (+5% from last year). (Wyzowl, 2022)
- LinkedIn Live streams have increased by 158% since February 2020. (LinkedIn, 2020)
- According to LinkedIn, video content generates 20 times more shares than other types of content on its platform. (Post Beyond, 2020)
- The maximum length for LinkedIn videos is 10 minutes but the network recommends that the ideal length depends on your objective. For brand awareness and consideration, LinkedIn says that a video under 30 seconds has a 200% lift in completion rates. (Sprout Social, 2020)
Twitter Video Statistics
- Twitter recommends videos be 15 seconds or less. (Sprout Social, 2020)
- Tweets with video get 2.5x more replies, 2.8x more Retweets and 1.9x more likes. (Sprout Social, 2022)
- More than 2 billion video views happen every day on Twitter, which is 67% year-over-year growth. (Twitter, 2019)
- Tweets with video attract 10x more engagement than Tweets without video. (Twitter, 2019)
- Promoted Tweets with videos save more than 50% on cost-per-engagement. (Twitter, 2019)
Snapchat Video Statistics
- Snapchat had a big jump in perceived effectiveness, increasing from 1% to 13% – a mind-bending increase of 1200%. (Hootsuite, 2022)
- In a 2019 study, 50% of social media users watched videos on Snapchat. (Sprout Social, 2020)
- Snapchat recommends that you keep it within 3 to 5 seconds with the call to action in the first 3 seconds. (Sprout Social, 2020)
YouTube Statistics
- For the eighth consecutive year, YouTube remains the most widely used platform for video marketers – 86% of video marketers have used it this year. (Wyzowl, 2022)
- Longer Youtube videos at a minimum of 10 minutes have been more popular lately, possibly because that’s the point at which creators are able to insert ads. (Sprout Social, 2020)
- YouTube surpassed all other networks, with 78% of those surveyed having watched a video on the network in the last 24 hours. (Sprout Social, 2020)
- More than 500 hours of video are uploaded to YouTube every minute. (Sprout Social, 2022)
- More than one billion hours of video content are consumed on YouTube daily. (Sprout Social, 2022)
There are 2,291 million global active users on YouTube as of January 2021. (Hootsuite, 2021) - Over 100 million people watch YouTube TV on their TV screens each month in the U.S. (Think with Google, 2020)
- 1 billion total hours of video are watched each day on YouTube. (Hootsuite, 2021)
TikTok Video Statistics
- For the third consecutive year, TikTok adoption increased by 10%, this year reaching 30% (compared to 10% in 2019, and 20% in 2020.) There was also a 10% in the effectiveness rating of TikTok, which reached 77%. (Wyzowl, 2022)
- 33% of video marketers plan to include TikTok in their 2022 video marketing strategy. (+13% from last year). (Wyzowl, 2022)
- A 61% increase in mentions year over year during the first half of 2021, converted into new users, making it the first non-Facebook app to reach 3 billion global downloads. (HubSpot, 2022)
- TikTok’s jump in perceived effectiveness rocketed from 3% last year to 24% this year—a 700% increase. (Hootsuite, 2022)
This post was originally published on December 17, 2020. It was updated on July 14, 2023.

")

